
Titanic Predictions
The Titanic data set is a well known data set used in Kaggle challenges. This blog post will discuss the tutorial provided by Kaggle for the Titanic data set, as well as some additional contributions .
Kaggle challenge: https://www.kaggle.com/c/titanic
The maximum amount of code has been referred from https://www.kaggle.com/alexisbcook/titanic-tutorial and added Contribution Section at the end of the blog post.
import numpy as np
import pandas as pd
import matplotlib.pyplot as plt
import seaborn as sns
Importing all the required packages as per requirement.
-
Now in next step lets read the given datasets by using pd.read_csv("").
-
The datasets are provided by Kaggle. The datasets provided are Train.csv,Test.csv and gender_submission.csv.
-
The train.csv consists of 891 entries with 12 rows.
-
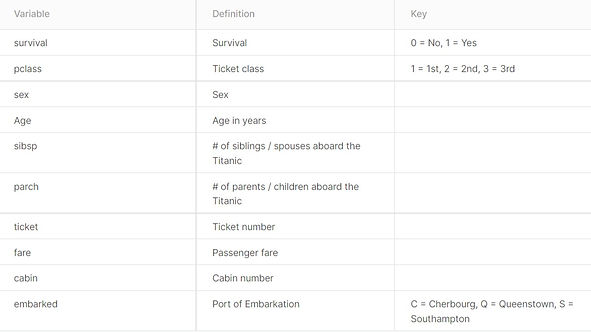
The training data set contains the following information about each passenger:
_edited.jpg)
The testing dataset consists similar attributes as training dataset except for "Survival" column.
train_data = pd.read_csv("C://Users//aleti shivani reddy//Downloads//titanic//train.csv")
train_data.head(10)
test_data = pd.read_csv("C://Users//aleti shivani reddy//Downloads//titanic//test.csv")
test_data.head(10)
Retrieving training and testing datasets by using pd.read_csv(""). This helps to read all the data which present in .csv files.
train_data.head() - This command helps to extract first five rows of train_data.csv
head(10) - will retrieve first 10 rows of the particular table.
train_column_Age_means = train_data.Age.mean()
train_data.Age = train_data.Age.fillna(train_column_Age_means)
print(train_data.Age)
test_column_Age_means = test_data.Age.mean()
test_data.Age = test_data.Age.fillna(test_column_Age_means)
print(test_data.Age)
Data Manipulation : Replacing of Nan values of age column with mean values of age .
mean() - helps to find mean .
fillna() - helps to fill all the null values
In above code we have train_data.Age.mean() where we can find mean of all the age values.
train_data.Age.fillna(train_column_Age_means) - helps to replace Nan values with mean of age.
Similarly, Testing data is been manipulated .
test_data.columns
o/p: Index(['PassengerId', 'Pclass', 'Name', 'Sex', 'Age', 'SibSp', 'Parch', 'Ticket', 'Fare', 'Cabin', 'Embarked'], dtype='object')
columns helps to retrieve column names of the particular table.
survived = 'survived'
not_survived = 'not survived'
fig, axes = plt.subplots(nrows=1, ncols=2,figsize=(10, 4))
women = train_data[train_data['Sex']=='female']
men = train_data[train_data['Sex']=='male']
ax = sns.distplot(women[women['Survived']==1].Age.fillna(test_column_Age_means), bins=18, label = survived, ax = axes[0])
ax = sns.distplot(women[women['Survived']==0].Age.fillna(test_column_Age_means), bins=40, label = not_survived, ax = axes[0])
ax.legend()
ax.set_title('Female')
ax = sns.distplot(men[men['Survived']==1].Age.fillna(test_column_Age_means), bins=18, label = survived, ax = axes[1])
ax = sns.distplot(men[men['Survived']==0].Age.fillna(test_column_Age_means), bins=40, label = not_survived, ax = axes[1])
ax.legend()
ax.set_title = ax.set_title('Male')
female = train_data.loc[train_data.Sex == 'female']["Survived"]
rate_women = sum(female)/len(female)
print("% of women who survived:", rate_women)
male = train_data.loc[train_data.Sex == 'male']["Survived"]
rate_men = sum(male)/len(male)
print("% of men who survived:", rate_men)
_edited.jpg)
o/p: % of women who survived: 0.7420382165605095
% of men who survived: 0.18890814558058924
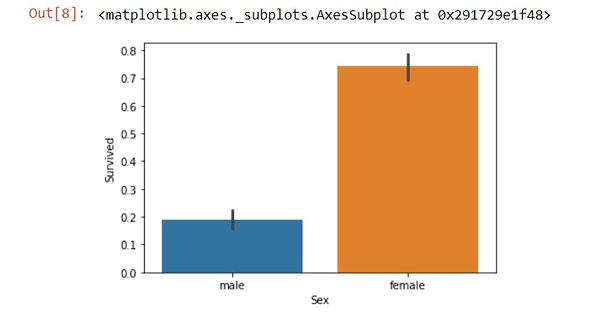
when we compare percentage between men and women, survival of women is much higher.
sns.barplot(x='Sex', y='Survived', data=train_data)
_edited.jpg)
sns.barplot is used to plot the values in bar graph by importing seaborn library.
In above code we are trying to display male and female data through bar graph.
passenger_class = train_data.loc[train_data.Pclass == 1]["Survived"]
passenger_class = sum(passenger_class)/len(passenger_class)
print("passenger_class 1 who survived:", passenger_class)
passenger_class = train_data.loc[train_data.Pclass == 2]["Survived"]
passenger_class = sum(passenger_class)/len(passenger_class)
print("passenger_class 1 who survived:", passenger_class)
passenger_class = train_data.loc[train_data.Pclass == 3]["Survived"]
passenger_class = sum(passenger_class)/len(passenger_class)
print("passenger_class 1 who survived:", passenger_class)
o/p: passenger_class 1 who survived: 0.6296296296296297
passenger_class 2 who survived: 0.47282608695652173
passenger_class 3 who survived: 0.24236252545824846
The above code displays % who survived in specific Passenger class. The classes present in Passenger class are 1,2,3 according to the given dataset.
Train_data.loc[] - helps you to locate particular data value
Train_data.Pclass == 3 , we are trying to extract passenger survival based on Pclass under "3".
Constructing a Random Forest Classifier utilizing the attributes
At first we are trying to store trained data survived data and letting it store in y variable,
The features we are trying to extract from particular data set for the purpose of prediction are :
-
PassengerId
-
Pclass
-
Parch
-
SibSp
-
Sex
-
Age
pd.getDummies() - This function is heavily used within machine learning algorithms. For instance, random forrest doesn’t do great with columns that have labels. It’s best to turn these into dummy indicator columns.
we will turn train_data[features] and test_data[features] into dummy indicators.
The model RandomForestClassifier is been implemented .
RandomForestClassifier(n_estimators=100, max_depth=5, random_state=1)
estimators - The number of trees in the forest.
max_depth - The maximum depth of the tree.
random_state - Controls both the randomness of the bootstrapping of the samples used when building trees
fit() - Builds a forest of trees from the training set (X, y).
predict() - Predicts class for X.
output = pd.DataFrame({'PassengerId': test_data.PassengerId, 'Survived': predictions})
This above code helps to extract only passenger id and survived predictions from predicted data model.
output.to_csv('C://Users//aleti shivani reddy//Downloads//titanic//submission.csv', index=False)
This code generates csv file with two columns PassengerId and Survived, gets saved in the path provided in qoutes.
from sklearn.ensemble import RandomForestClassifier
y = train_data["Survived"]
features = ['PassengerId', 'Pclass', 'Parch', 'SibSp','Sex','Age']
X = pd.get_dummies(train_data[features])
X_test = pd.get_dummies(test_data[features])
model = RandomForestClassifier(n_estimators=100, max_depth=5, random_state=1)
model.fit(X, y)
predictions = model.predict(X_test)
print(predictions)
output = pd.DataFrame({'PassengerId': test_data.PassengerId, 'Survived': predictions})
output.to_csv('C://Users//aleti shivani reddy//Downloads//titanic//submission.csv', index=False)
print("Your submission was successfully saved!")
[0 0 0 0 0 0 0 0 1 0 0 0 1 0 1 1 0 0 0 0 0 1 1 0 1 0 1 0 0 0 0 0 0 0 0 0 0 0 0 0 0 0 0 1 1 0 0 0 1 0 0 0 1 1 0 0 0 0 0 1 0 0 0 0 1 1 1 0 0 1 0 0 0 0 1 0 0 1 0 0 1 0 0 0 0 0 0 1 0 1 0 0 1 0 0 0 1 0 1 0 1 0 0 0 0 0 0 0 0 0 0 0 1 1 1 0 0 1 0 1 1 0 1 0 0 0 0 0 0 0 0 0 0 0 0 0 0 0 0 0 0 1 0 0 0 0 0 0 0 0 1 0 0 0 0 0 1 0 0 0 0 1 1 0 0 0 0 0 1 0 0 0 0 0 0 1 1 0 1 1 0 0 1 0 1 0 1 0 0 0 0 0 0 0 1 0 1 1 0 0 0 1 0 1 0 0 0 0 1 0 0 0 0 1 0 0 0 0 1 0 1 0 1 0 1 0 0 0 0 0 0 1 0 0 0 0 0 0 1 1 1 1 0 0 0 0 1 0 1 0 1 0 0 0 0 0 0 0 1 0 0 0 1 1 0 0 0 0 0 0 0 0 1 0 0 1 0 0 0 0 0 1 0 0 1 0 0 0 0 0 0 0 0 0 0 0 1 0 0 0 0 0 0 0 0 1 0 1 0 0 0 0 0 0 1 1 0 0 0 0 0 0 0 0 1 0 1 0 0 0 1 0 0 0 0 0 0 0 0 0 0 0 0 1 0 1 0 0 0 1 1 0 0 0 1 0 1 0 0 0 0 1 1 0 1 0 0 0 1 0 0 1 0 0 1 1 0 0 0 0 0 0 0 0 0 1 0 0 0 0 0 1 0 0 0 1 0 1 0 0 1 0 1 0 0 0 0 0 0 1 0 1 0 0 1 0 0 0]
Your submission was successfully saved!
submission_data = pd.read_csv("C://Users//aleti shivani reddy//Downloads//titanic//submission.csv")
print(submission_data.head(10))
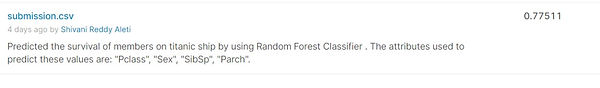
After submitting above code in kaggle the score received is 0.78229. before adding above contributions the score was around 0.77511.
_edited.jpg)
_edited.jpg)
CONTRIBUTIONS
-
Data manipulation: Found mean values of age and filled Nan values with mean Age values for train and test data.
-
Added few more attributes in Features : Age, PassengerId to extract more optimised survival rate.
REFERENCES
-
https://seaborn.pydata.org/generated/seaborn.barplot.html#seaborn.barplot - used as a reference for barplot syntax
-
https://scikit-learn.org/stable/modules/generated/sklearn.ensemble.RandomForestClassifier.html- used as a reference to understand random forest classifier
-
https://seaborn.pydata.org/generated/seaborn.distplot.html - used as a reference to display displot graph for survival rate between men and women